Annual Report 2017/18 Registration
Performance snapshot
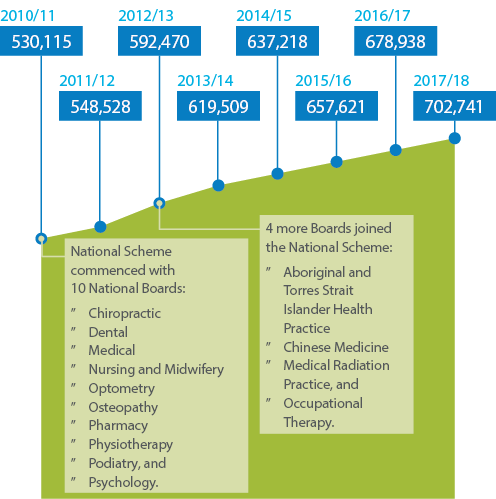
- 702,741 practitioners across all 15 professions were registered in 2017/18 (up 3.5% from 2016/17)
- 6.9% increase in new applications
- 7,193 audit cases closed and 5,890 new audits initiated for practitioners
- Time to decide the outcome of an application:
- median time of 7 days (down from 10 in 2016/17)
- average of 23 days (down from 28 days in 2016/17)
- Highest online renewal rate ever achieved, with 99.0% of all eligible practitioners renewing their registration online
Registered practitioners
The number of registered health practitioners in the National Scheme grew by 3.5% this year, to 702,741 (refer to Table 3). This is consistent with growth trends since the Scheme began in July 2010 (see Figure 3). Of the registrant base, 97.7% hold some form of practising registration. The proportion of registrants who hold an expanded scope of practice due to an approved specialty is 10.1%, and due to an endorsement is 2.8%.
Each profession has different categories of registration. For more information, visit the AHPRA website, choose the relevant National Board, then click the 'Registration' tab.
Notes:
- No principal place of practice (No PPP) includes practitioners with an overseas or unknown address.
- Registrants who hold dual registration as both a nurse and a midwife.
- Throughout this report, the term 'podiatrist' refers to both podiatrists and podiatric surgeons unless otherwise specified.
The Register of practitioners
According to the National Law, AHPRA is required to publish and maintain a publicly accessible register of practitioners so that important information about the registration of any health practitioner is easy to find. The Register of practitioners was built with data from multiple sources when the National Scheme began.
Our online Register of practitioners has accurate, up-to-date information about the registration status of all registered health practitioners in Australia. As decisions are made in relation to a practitioner's registration/renewal or disciplinary proceedings, the register is updated to inform the public about the current status of individual practitioners and any restrictions placed upon their practice.
Tribunal decisions that result in the cancellation of a practitioner's registration due to health, performance or conduct issues result in the individual appearing on a Register of cancelled practitioners.
During the year, the Medical Board of Australia started to publish links to disciplinary decisions by courts and tribunals on the register when there has been an adverse finding about a doctor. The Board decided to introduce links to public tribunal decisions, in the interests of transparency and on the recommendation of the Independent review of the use of chaperones to protect patients in Australia. Over the coming year, this approach will also be adopted by other National Boards.
AHPRA also has an ongoing program of work to improve the accuracy of our data on the register. This work will continue in 2018/19.
Search the Register of practitioners.
The Aboriginal and Torres Strait Islander health workforce
AHPRA and the National Boards are committed to closing the gap in health outcomes between Aboriginal and Torres Strait Islander Peoples and other Australians. To help support workforce policy and planning, AHPRA and the National Boards facilitate the collection of data on the number of registered health practitioners who identify as Aboriginal and/or Torres Strait Islander.
This year, Aboriginal and/or Torres Strait Islander participation across the regulated health professions was 0.9% (refer to Table 4), which is consistent with data collected in previous years but well short of the 2.8% Aboriginal and Torres Strait Islander representation in the general population. Increasing participation in the registered health workforce is one of the goals of the National Scheme, work on which will begin next year.
All registrants in the Aboriginal and Torres Strait Islander Health Practice profession identified as being Aboriginal and/or Torres Strait Islander (it is a requirement of registration in that profession). The profession with the second highest percentage representation was in nursing and midwifery, which had 1.1% of its workforce identifying as being Aboriginal and/or Torres Strait Islander.
To find out more about the work AHPRA and the National Boards are doing to support health equity for all Australians, see Strategy, research and policy.
Source: NHWDS medical practitioners data 2013–17, NHWDS nursing and midwifery data 2013–17, NHWDS allied health data 2013–17
Notes:
- Data shown in this table represent those practitioners who identified themselves as being born in Australia and Aboriginal and/or Torres Strait Islander in a workforce survey conducted at the time of renewal of registration.
- Note that the 2017 allied health data were not available at time of publication. This total and proportion is subject to change.
- The Aboriginal and Torres Strait Islander Health Practitioners figure in Table 4 is different from Table 3 due to the point in time at which the data were extracted.
- The workforce survey has very high response rates, making it a good source of information on the participation of Aboriginal and Torres Strait Islanders in the health workforce. However, accuracy is not guaranteed due to the survey's voluntary nature. A small number of these practitioners will hold dual registration and may be counted twice.
Student registration
Under the National Law, a National Board must decide whether students who are enrolled in an approved program of study or undertaking clinical training should be registered. A student does not need to apply for registration, as education providers are responsible for arranging the registration of all their students with AHPRA. The student register is not made public. All National Boards have decided to register students, except for the Psychology Board of Australia, which requires provisional registration. Refer to Table 5.
The accuracy of the student registration information AHPRA receives depends on the quality of data supplied to us by education providers. We continue to work with more than 130 education institutions to improve the exchange of information and identify the status of students to ensure that information is accurate, particularly in relation to completion/cessation of students who may have otherwise remained on the student register.
Notes:
- Student figures are based on the number of students reported as undertaking an approved program of study/clinical training program within the relevant financial year. This may include ongoing students or students with a completion date falling within the period. These data reflect the information received from education providers.
- Approved programs of study refer to those students enrolled in a course that has been approved by a National Board and leads to general registration. These courses can be found on the Approved Programs of Study page on the AHPRA website.
- Clinical training has been defined as any form of clinical experience that does not form part of an approved program of study.
Please note that the student registration data is being reviewed as some discrepancies have been identified - December 2018.
New applications for registration
AHPRA receives applications for registration on behalf of the National Boards. Before a practitioner can practise and use a title protected under the National Law, applicants must provide evidence that they are eligible to hold registration, and registration must be granted.
This year, AHPRA received 73,759 applications, up 6.9% from 2016/17. Of these, 94.7% sought practising registration. There was a 0.7% decrease in practitioners applying for non-practising registration when compared with last year (see 'Registration type' in the Glossary).
To improve the registration experience, a staged approach to digitise registration forms delivered improvements to the online registration process for new graduates, with 92% of end-of-year graduates taking up online submission during this peak registration period. This work will continue in 2018/19, particularly in preparation for the inaugural registration process for the Paramedicine Board of Australia.
Examinations
AHPRA delivers examinations to support the registration requirements of the Pharmacy Board of Australia, the Psychology Board of Australia and the Medical Radiation Practice Board of Australia.
The following examinations were held in 2017/18:
- Pharmacy Board of Australia – AHPRA administered the oral examination (practice) in October 2017, February 2018 and June 2018. Trained examiners assessed 1,745 candidates.
- Psychology Board of Australia – 761 candidates sat the national psychology examination. This exam is delivered at test centres in each capital city on a quarterly basis.
- Medical Radiation Practice Board of Australia – 37 candidates sat the national exam.
Criminal history checks
AHPRA requested 78,407 domestic and international criminal record checks of practitioners and/or applicants for registration this year, an increase of 11.1% since 2016/17 (refer to Table 6).
Overall, 4.3% of the results indicated that the applicant had a disclosable court outcome. All disclosable court outcomes are assessed in accordance with the Criminal history registration standard, which is common across all 15 National Boards. Visit the Criminal history page on the AHPRA website.
In the majority of cases, the applicant was granted registration because the nature of an individual's disclosable court outcome had little relevance to their ability to practise safely and competently.
No applicants had conditions imposed on their registration due to their disclosable court outcome, which is the same as it was in 2016/17. In 2015/16 there were 10 applicants who had conditions imposed. One applicant was refused registration, compared with none in 2016/17 and one in 2015/16.
Notes:
- Data are by principal place of practice.
- Refers to both domestic and international criminal history checks submitted. International criminal history checks started in 2014/15.
- The National Law requires that all criminal history be released. In Tasmania, police include traffic offences such as speeding and seatbelt use in their definition of ‘criminal history', while other states and territories do not.
- No principal place of practice (No PPP) includes practitioners with an overseas or unknown address.
How we check criminal history
Under the National Law, applicants for initial registration must undergo criminal history checks. Applicants seeking registration must disclose any criminal history information when they apply for registration, and practitioners renewing their registration are required to disclose if there has been a change to their criminal history status in the preceding 12 months.
International applicants seeking registration in Australia and certain registered health practitioners, including those registered under Trans Tasman Mutual Recognition arrangements, need to obtain an independent international criminal history check from an AHPRA-approved supplier, who will provide the report to the applicant as well as directly to us. A check is required when an applicant or practitioner declares an international criminal history and/or has lived, or been primarily based, in any country other than Australia for six consecutive months or more, when aged 18 years or over. AHPRA may also seek a report from a police commissioner or an entity in a jurisdiction outside Australia that has access to records about the criminal history of people in that jurisdiction. Criminal history reports are one part of our assessment of an applicant's suitability to hold registration.
While a failure to disclose criminal history by a registered practitioner does not constitute an offence under the National Law, it may constitute behaviour for which a National Board may take action on the grounds of health, conduct or performance.
Outcomes for applications finalised
In partnership with the National Boards, we consider every application for registration carefully and assess it against requirements for registration set by each Board. Only those practitioners who are suitably trained and qualified to practise in a competent and ethical manner are registered. Where appropriate to protect the public, and in accordance with the regulatory principles of the National Scheme, National Boards may decide to impose conditions on a practitioner's registration or refuse the application entirely.
There were 73,614 decisions made about applications for registration in 2017/18. Of these, 6.6% resulted in conditions being imposed on a practitioner's registration, or a refusal of registration, in the public interest. Refer to Table 7.
The average time taken to finalise a complete application for registration this year was 23 days, which is an improvement from the previous year's average of 28 days. This timeframe remains within our service commitment to manage the majority of complete applications within 4–6 weeks.
Note:
- If an applicant cannot demonstrate that they meet the eligibility, suitability and/or qualification requirements of the relevant National Board, their application will be refused.
Renewing registration
Once on the register, health practitioners must apply to renew their registration each year and be reassessed against registration requirements. There are three annual renewal periods:
- nurses and midwives must apply by 31 May
- most medical practitioners by 30 September, and
- other health practitioners by 30 November.
In 2017/18, AHPRA renewed registration for 646,900 practitioners across Australia. As with new applications for registration, National Boards may impose conditions on a practitioner's registration or refuse renewal entirely.
This year we continued to reap the benefits of the 2016/17 awareness campaign about renewal, which included online materials such as improved ‘user friendly' renewal forms, reminders and a campaign video that explains how to renew online and other helpful links about renewal.
We saw the highest online renewal rate ever achieved, with 99.0% of all eligible practitioners renewing their registration online (24,056 more practitioners than last year, an increase of 0.5%). This is attributed to both the renewal campaign improvements and the repeat take-up by new graduates who deal with online registration processes from the time they are first registered. The high rate of online renewals enhances the practitioner experience and reduces costs associated with mailing out hard-copy reminders. AHPRA surveyed practitioners at the end of the renewal campaign to get feedback about their experience. We are committed to improving systems and processes to make it easier for practitioners to use our online services.
Practitioner audits
Auditing compliance
AHPRA conducts regular audits of health practitioners on behalf of the National Boards. Audits provide assurance that practitioners understand the registration standards for their profession and are meeting these obligations.
Since we began conducting audits in 2012, the vast majority of practitioners audited have been found to comply with registration standards. About 3% of those audited have either surrendered their registration or moved to non-practising registration while being audited. Analysis of the circumstances of those practitioners demonstrates two clear groups:
- practitioners residing overseas, and
- those no longer practising but maintaining registration.
In 2017/18, AHPRA initiated 5,890 new audits for practitioners across all 15 professions. All National Boards audited compliance with one or more of the registration standards. We closed 7,193 audits in 2017/2018, while 2,217 remain open and subject to ongoing management.
Of the completed audits, nearly 94% of practitioners were found to be in full compliance with the registration standards being audited. We analysed the audit outcomes to better understand why non-compliance occurs. In some professions, practitioners were not always fully aware of specific requirements for continuing professional development. This is being addressed through increased communication about what is required to comply with professional development standards.

 93.6% compliant: fully compliant with the registration standards
 2.9% compliant (education): compliant through education in one or more standards
 0.7% non-compliant: non-compliant with one or more standards
 2.8% no audit action required: practitioners who changed their registration type to non-practising or surrendered their registration after being advised they were subject to audit
How our audit process works
Registered practitioners are required to comply with a range of national registration standards. Each time a practitioner applies to renew their registration they must make a declaration that they have met the standards for their profession. Our auditing provides additional assurance to the public, Boards and practitioners that the requirements of the National Law are understood and that practitioners are compliant with their Board's standards. During an audit, a practitioner is required to provide evidence to support the declarations made in the previous year's renewal of registration.
The standards that may be audited are:
- continuing professional development
- recency of practice
- professional indemnity insurance arrangements, and
- criminal history.
All Boards have adopted an educational approach to conducting audits, seeking to balance the protection of the public with the use of appropriate regulatory force to manage those practitioners found to be less than fully compliant with the audited standards. Practitioners who are found to have not quite met the registration standard, but are able to provide evidence of achieving full compliance during the audit period, are managed through education to achieve full compliance.
Practitioners who are very close to meeting their registration standard are given the chance to achieve full compliance by undertaking education during the audit period. These practitioners are recorded as being 'compliant (education)'. In 2017/18, this contingent represented 2.9% of completed audits. See Figure 4.
Non-compliant with standards
When an audit finds that a practitioner has not met the requirements of the registration standards, all Boards follow an approach that aims to work with the practitioner to ensure compliance before the next renewal period. This may include formally cautioning the practitioner about the importance of complying with registration standards.
All matters that involve issuing a caution or placing conditions on a registration are subject to a 'show cause' process. This process alerts the practitioner of the intended action and gives them an opportunity to respond before a decision is made.
Of the practitioners found to be non-compliant in 2017/18, 94.2% resulted in some form of regulatory action being taken (such as cautions and imposition of conditions). The remaining 5.8% resulted in no further action. In these matters, further information was received from the practitioner that identified that there was no risk to the public that would warrant regulatory action being taken.