AHPRA Annual Report 2015/16
Performance summary
An overview of AHPRA’s performance across key functions

657,621 health practitioners in 14 professions registered in Australia in 2015/16
There were almost 20,000 more registrants in 2015/16 than last year (up from 637,218)

65,274 applications for registration received across all professions
153,710 students studying to be health practitioners through an approved program of study or clinical training program

66,698 domestic and international criminal history checks undertaken
3,275 (4.91%) of these found disclosable court outcomes, which resulted in limitation of the registration of 10 practitioners and refusal of registration in 1 case

94% of practitioners completed the online workforce survey that was sent out on renewal
98% of nurses and midwives now renew and complete their annual registration online

Statutory offences
1,013 advertising-related complaints received; 374 were closed

15 offence complaints relating to practice; 15 were closed

288 offence complaints received relating to title protection; 194 closed
11 cases of falsely claiming to be a registered health practitioner successfully prosecuted before the courts
(Note: all totals and percentages in this section are inclusive of AHPRA and NSW data)

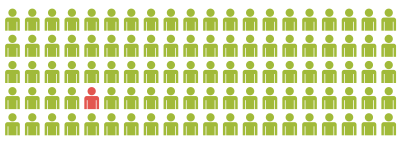
1.5% of 657,621 practitioners were the subject of a notification
10,082 notifications in 2015/16
81% of finalised ‘immediate actions’ – for the most serious risks to public safety – led to restrictions on registration.
(Restrictions include suspension, conditions, undertakings or surrender of registration.)
19.7% increase in notifications lodged

17.7% increase in mandatory notifications
18.3% increase in notifications about medical practitioners
13.2% increase in nursing and midwifery notifications

53.3% of notifications were about medical practitioners, who make up 16.3% of total practitioners

102 appeals lodged in tribunals about Board decisions made under the National Law
Of the 63 appeals that were finalised, 88.9% resulted in no change to the Board decision as an outcome of the appeal (21 where the original decision was confirmed, and 35 where the appeal was withdrawn)

Of the health, performance and conduct matters decided nationally by tribunals this year, 86.6% resulted in disciplinary action

93% of health practitioners responded with ‘satisfied to very satisfied’ when asked to rate their interaction with our customer service teams

Our customer service teams resolved 93% of telephone calls at first contact
76 requests received for access to registered health practitioner data and information for research purposes

AHPRA received up to 1,480 phone calls and 175 web enquiries each working day, and close to 5,000 calls daily in peak times
Our 15 websites received more than 11.2 million visits in 2015/16 and more than 53.7 million page views
175 freedom of information applications were finalised
This year, there were a total of 623 appointments made:
106 Ministerial appointments of National Board members
247 National Board appointments of National Committees
60 Ministerial appointments of state, territory or region Board members
210 National Board appointments of state, territory or region Committee membership
